See what changed under the clouds.

SAR-Pulse turns NISAR L-band radar into validated surface-water change maps, so you can see where wetlands flooded or drained, and exactly how sure to be.

No sign-in. Real NASA–ISRO NISAR data, opening on the Sylhet case study with a 1-minute guided tour.

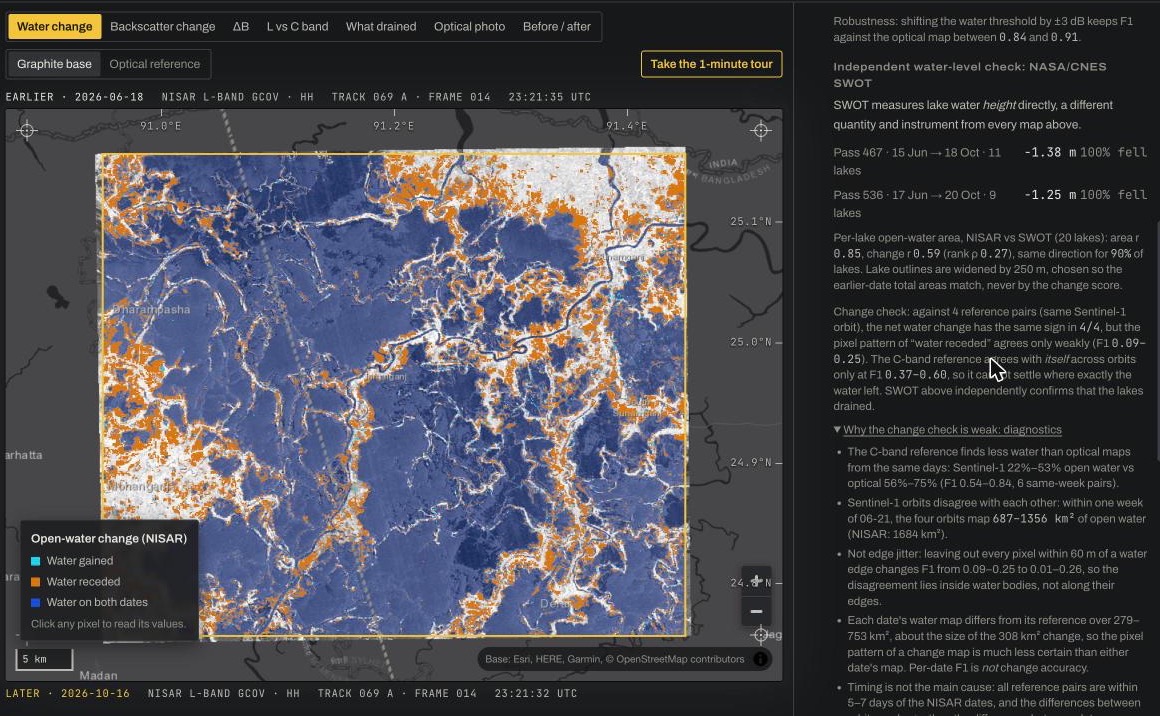
The SAR-Pulse app: Sylhet water-change map with the validation and confidence panel

THE LIVE APP · SYLHET · NISAR TRACK 069 A · 18 JUN → 16 OCT 2026

Built on open data from

  • NASA–ISRO NISAR
  • NASA OPERA
  • NASA/CNES SWOT
  • NASA GPM
  • NASA SMAP
  • NASA HLS
  • NASA CMR · Earthdata
  • ESA WorldCover
  • WorldPop

In 120 days, 308 km² of the Sylhet wetlands drained.

Between monsoon high water on 18 June and 16 October 2026, NISAR mapped open water across the 2,237 km² haor basin falling from 79% to 66%. Three independent NASA measurements tell the same story.

Water receded
308 km²
289–327 km² if the water threshold shifts ±1 dB
Cropland out of the water
281 km²
268–294 km²; where boro rice can be planted first
Water maps vs optical
F1 0.85–0.98
Five clear dates, NASA OPERA DSWx-HLS
Lake levels (SWOT)
−1.3 m
Every observed lake fell; uncertainty 3–5 cm
Rainfall (GPM)
364 → 24 mm
June vs October: the monsoon switched off first

A research tool, not an imagery viewer.

Pick a study area and two real radar passes. SAR-Pulse computes the change, checks it against everything independent it can find, and tells you what it can and cannot claim.

Radar that sees through the monsoon

Clouds hide flooded land from optical satellites for months. SAR-Pulse reads NISAR's L-band radar, which works day and night through cloud, and lines up two passes from the same orbit so the only thing that changed is the ground.

  • Only the study-area window is read from each ~7 GB NISAR file
  • Incompatible pairs are refused with the reason; mixed product versions are flagged
  • Calibration check on unchanged land: 0.00 dB for the Sylhet pair
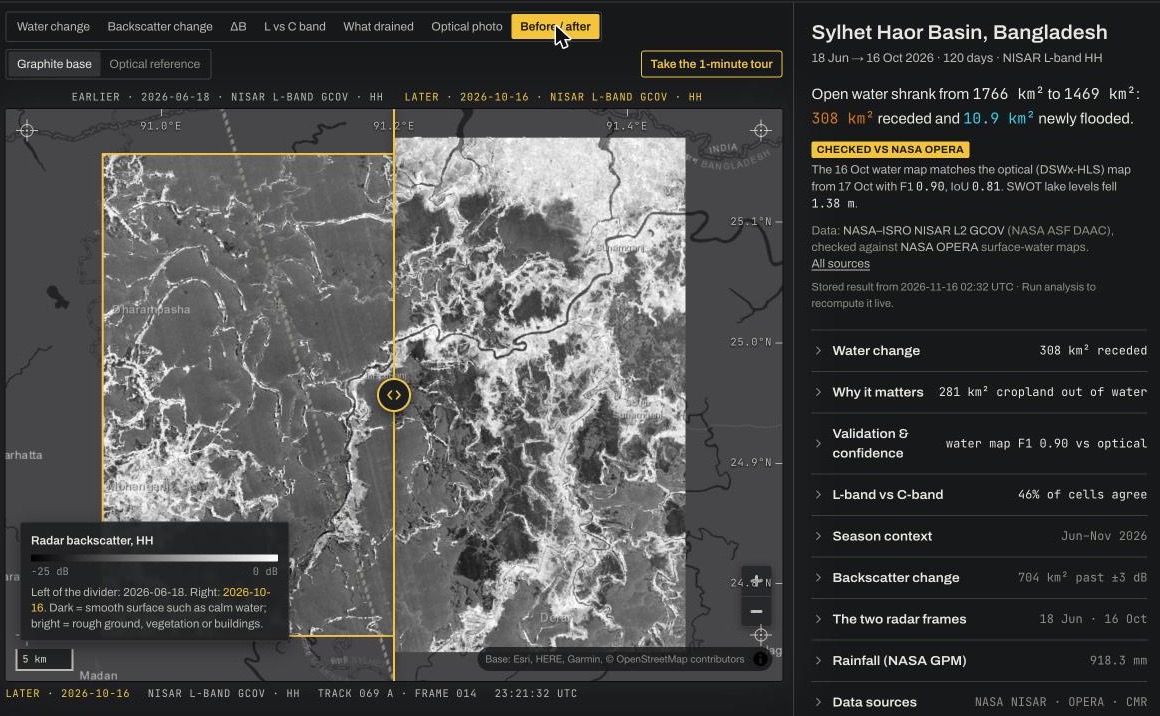
Before/after swipe across two real NISAR radar frames of the Sylhet basin, 18 June and 16 October 2026
Real NISAR frames, 18 Jun | 16 Oct 2026. Dark is calm water, bright is land and vegetation.

Every map checked against independent NASA data

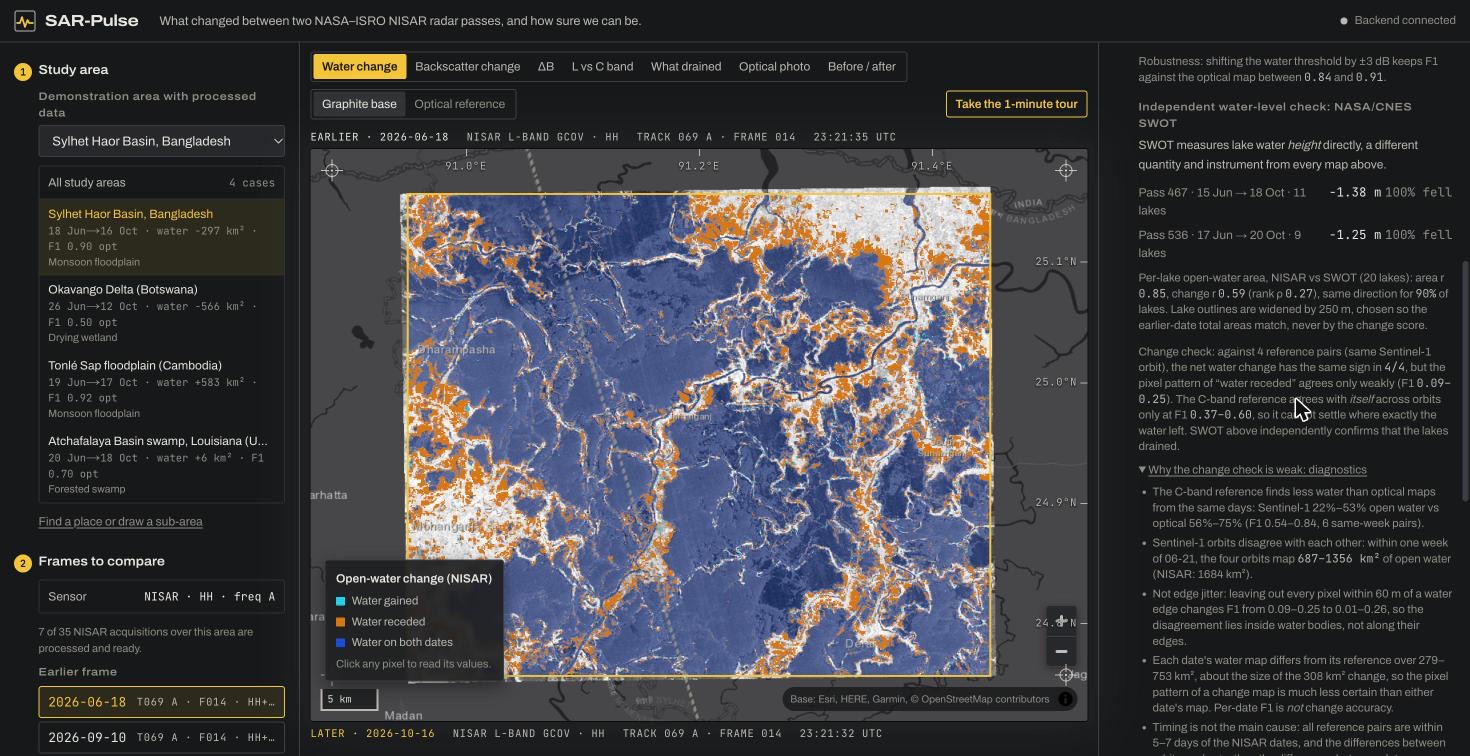
Each water map is scored against NASA OPERA's optical and radar water maps, and NASA/CNES SWOT measures the lake levels directly. The weak results are shown next to the strong ones, with the reason.

  • Single-date water maps vs optical: F1 0.85–0.98 at five dates
  • SWOT: every observed lake fell, median −1.38 m and −1.25 m
  • Where exactly water changed is less certain (pixel F1 0.09–0.30), and the panel explains why
SAR-Pulse validation panel beside the Sylhet water-change map, with SWOT results and change diagnostics
Validation & confidence panel, with the diagnostics for the weak change score expanded.

Two wavelengths, compared cell by cell

NISAR's L-band (24 cm) and Sentinel-1's C-band (5.6 cm) see wetlands differently. SAR-Pulse builds each band's change map from its own data and shows where they agree, by land cover, with confidence intervals.

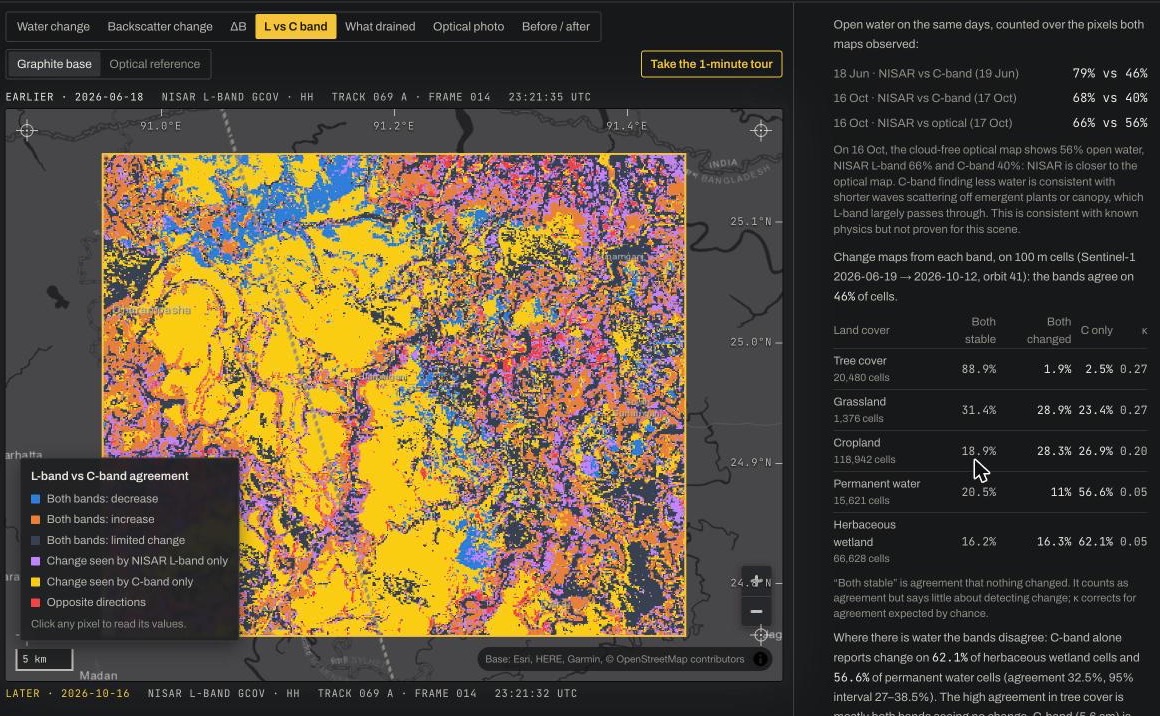
  • Open water: C-band alone reports change on 57% of cells in Sylhet, 58% in Tonlé Sap
  • Sylhet herbaceous wetland: 32.5% agreement (95% interval 27–38%, κ 0.05)
  • Robust to cell size, aggregation rule and threshold; the cause is plausible, not proven
Map of where NISAR L-band and Sentinel-1 C-band change maps agree or disagree, with the land-cover table
L vs C band view: agreement map and the land-cover breakdown.

From water to what it means on the ground

Drained land is broken down by land cover and set against population, with every figure given a range. In Sylhet, that shows where boro rice seedbeds can go in first.

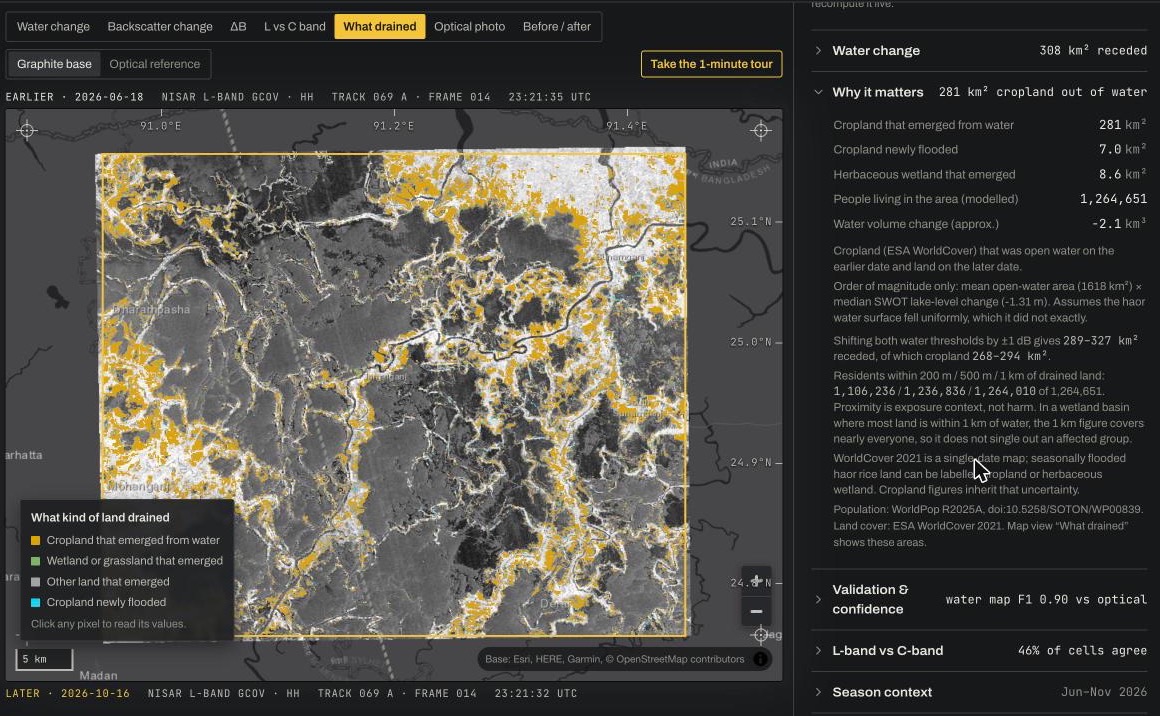
  • 281 km² of cropland came out of the water (268–294 km² for thresholds ±1 dB)
  • Season context from NASA GPM rainfall and SMAP soil moisture
  • Proximity to changing water is presented as context, not harm
What drained view: land that emerged from water coloured by land cover, with the impact panel
What drained view: cropland that emerged from water in amber.

How it works

  1. 01

    Discover

    Find NISAR L2 GCOV frames in NASA CMR and check that two passes are compatible.

  2. 02

    Calibrate

    Speckle-filter, convert to decibels, and confirm unchanged land did not move.

  3. 03

    Map water

    Pick the water threshold automatically for each image, only when the scene allows it.

  4. 04

    Validate

    Score against OPERA optical and radar maps, SWOT lake levels, and a second wavelength.

Thresholds are never tuned to the references used for validation. A new area runs with one command; 41 automated tests, 5 of them on the real Sylhet outputs.

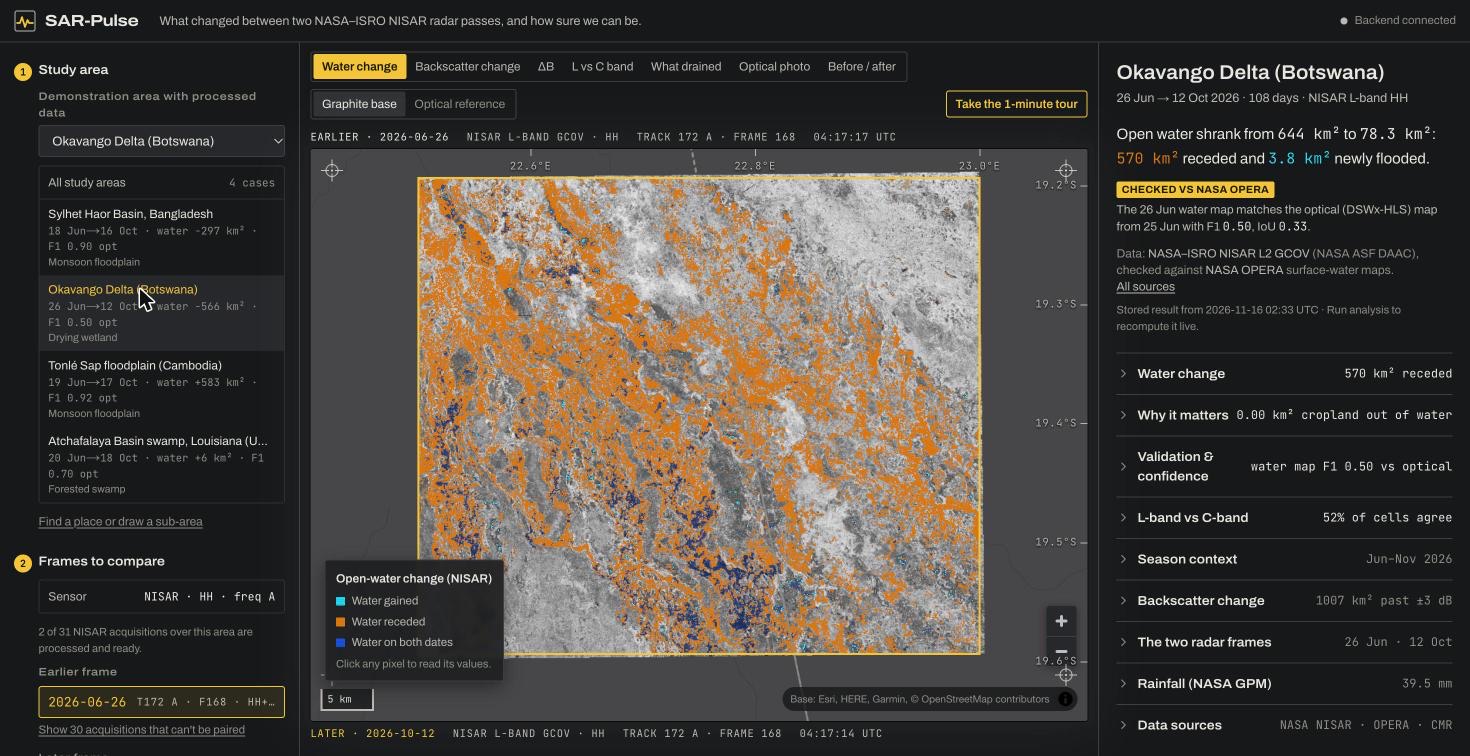
Four ecosystems, one pipeline.

The same method, with no per-site tuning, on a flooding lake, a drying delta and a forested swamp. The weak results stay in.

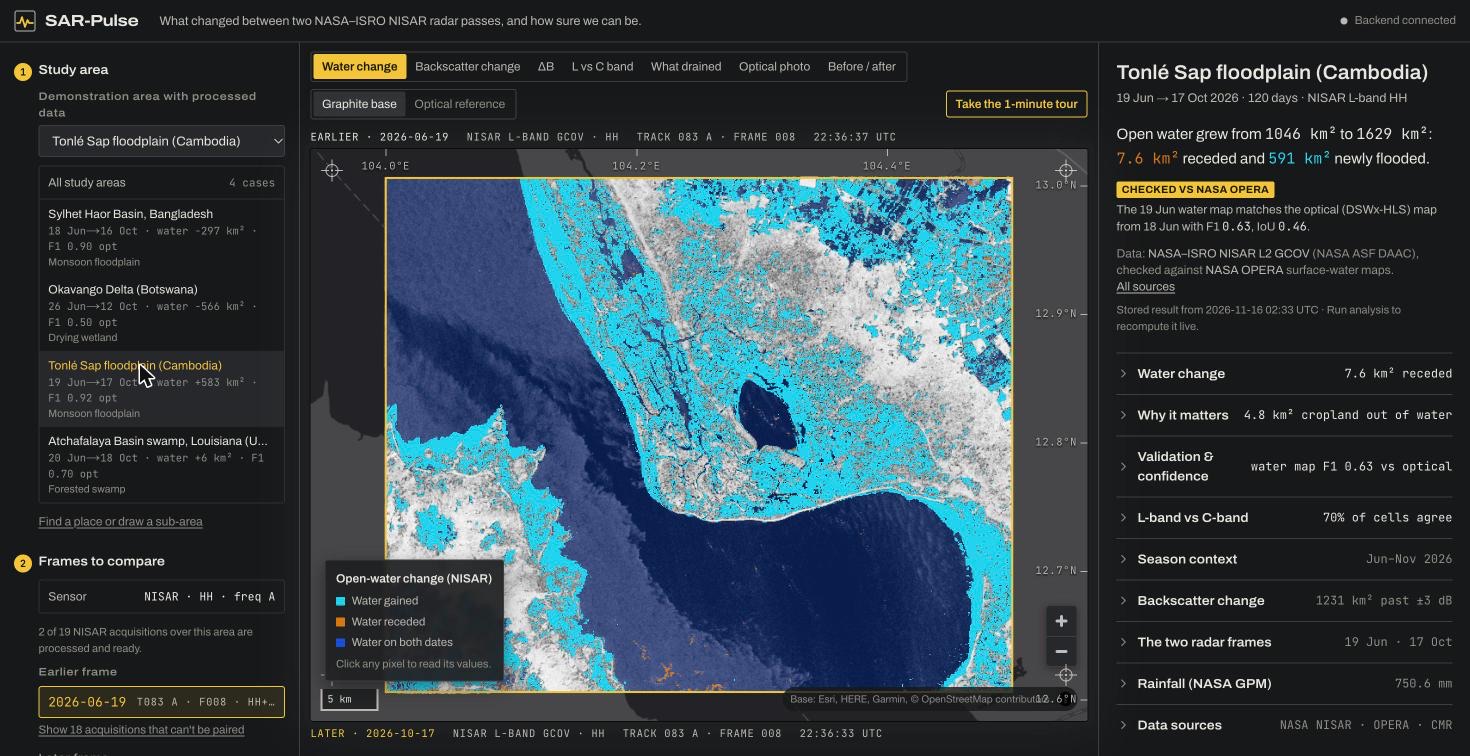
Tonlé Sap, Cambodia: open water that appeared between June and October 2026, in cyan
Tonlé Sap flooded: 591 km² of new open water (cyan).
Okavango delta, Botswana: open water that receded between June and October 2026, in orange
Okavango dried: 570 km² of water receded (orange). Optical agreement is weak here.

Optical F1 scores the water map on each date against NASA OPERA DSWx-HLS; it is not a score for the change itself.

What it can't tell you

Every limit is shown in the app next to the result it affects, not hidden behind a link.

  • No field ground truth: every reference is another satellite product.
  • Exactly where water changed, pixel by pixel, is not confirmed.
  • Water depth is not measured; flooded forest can be missed.
  • Land cover is a single 2021 map; population is modelled.

Open the light table and check it yourself.

Click any pixel, swipe between the radar passes, rerun the analysis live, or take the 1-minute tour.